Infrastructure Intelligence
NYC weather-corrected odor investigation program
An executive view of how New York City 311 complaint records, historical wind and GIS analysis are combined to narrow odor source search areas before crews are dispatched.
Total complaints
…
Sewer odor records in the analysis set
Average wind speed
…mph
0 records with matched weather
Predominant wind direction
…
Awaiting wind history
Most common complaint area
…
Awaiting records
Why weather data improves odor investigations
RationaleAn odor complaint records where a resident smelled the problem — not where it was released. Hydrogen sulphide and other sewer gases travel with the wind, so the reported address is a downwind receptor, often several blocks from the actual emission point. Investigating at the complaint address alone produces repeat visits, inconclusive findings and unresolved cases.
Pairing each complaint with the wind conditions recorded in that same hour reverses the transport path. Bearing tells the crew which way to look; speed indicates how far upwind the source plausibly sits. A cluster of complaints filed under similar wind conditions converges on a single candidate asset — a surcharged siphon, a dry trap, a force-main discharge or a plant bypass.
- Converts anecdotal reports into a defensible, repeatable spatial method.
- Reduces field search area from a whole neighbourhood to a bounded cone.
- Distinguishes recurring structural sources from one-off weather-driven events.
- Provides an auditable record for regulators, council and customer response.
Analysis workflow
6 stages- 01
Citizen complaint
311 record with timestamp, address and descriptor is ingested from open data.
- 02
Historical weather
Hourly reanalysis wind is matched to the exact hour the odor was reported.
- 03
Wind analysis
Speed and bearing are resolved to determine where the air mass came from.
- 04
GIS visualization
Points, wind vectors and clusters are rendered on a live basemap.
- 05
Potential source area
An upwind cone projects the probable emission footprint for each report.
- 06
Engineering investigation
Crews inspect manholes, siphons and force mains inside the ranked search area.
GIS evidence — spatial view
Screenshots from the map module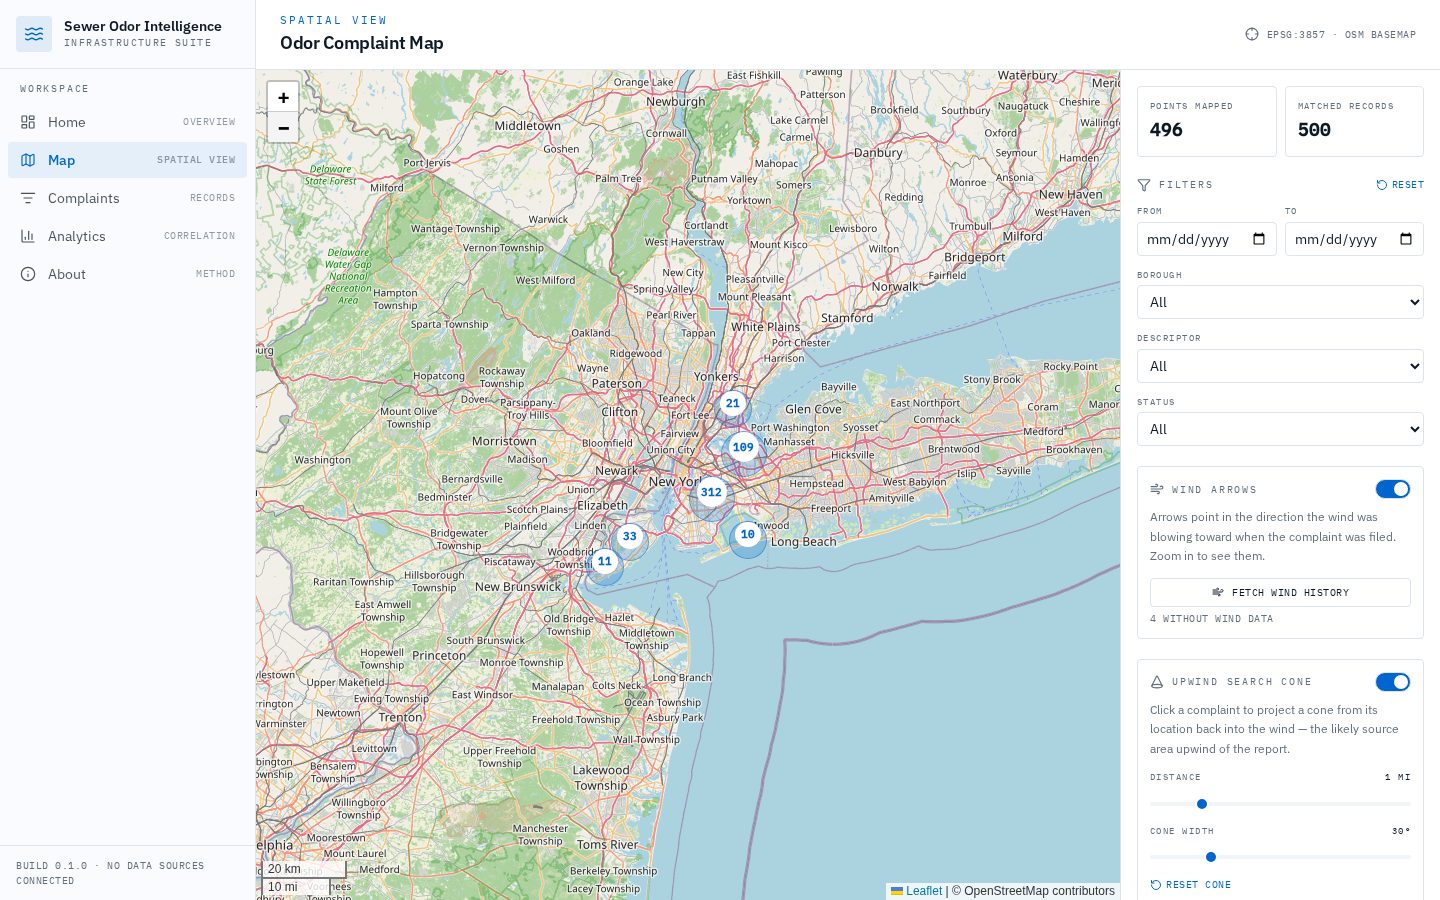
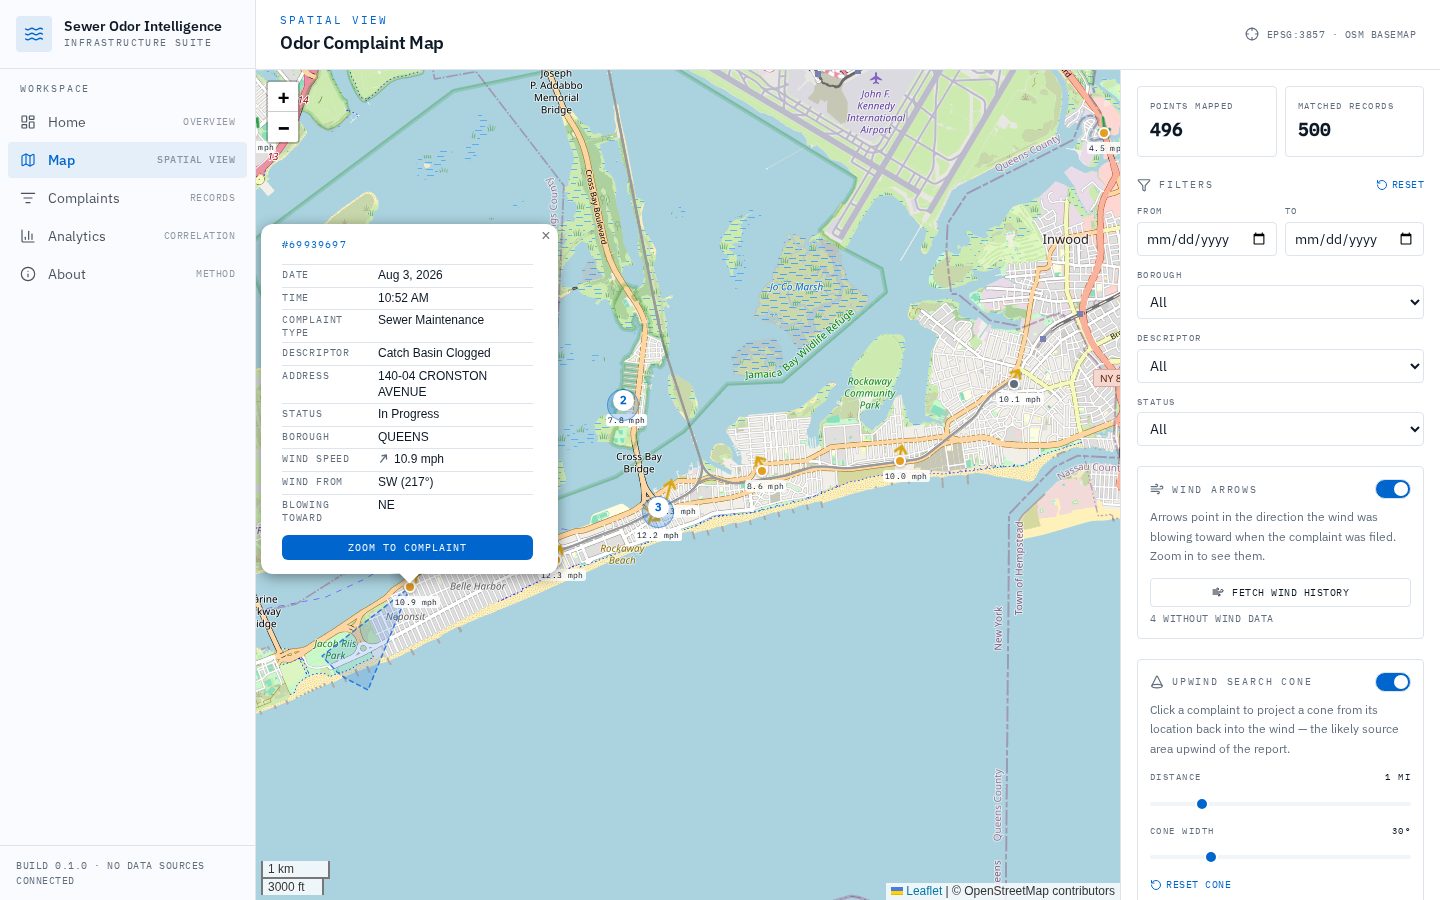
Basemap © OpenStreetMap contributors. Wind vectors are derived from hourly historical reanalysis matched to each complaint timestamp.
Operational implications
Program valueTargeted dispatch
Crews receive a ranked search polygon instead of a street address, cutting exploratory inspection time.
Capital prioritisation
Recurring source areas identify assets that warrant odor control, lining, or ventilation investment.
Customer confidence
Each closed case carries a documented meteorological and spatial basis for the conclusion reached.